 Archer: FX
Amazing how fast time flies when you’re juggling so much during the trying times we all have since 2020! At at the time of publishing this article, we are all still facing a lot of uncertainties. I hope time has been gracious to you all…and continues to be!
Why this post?
As we push through some very trying times in the Digital Forensic and Incident Response world, there are two things I’ve experienced during my tenure within this field:
- You are always being pushed to work faster than you did the engagement before
- Visualization is becoming more and more useful from both Presentation of Findings and for Quick Wins
With that being said, the two tools discussed in here have been linked together actually for a decent amount of time. However, there has not been a substantial post on HOW to make these two cohesively talk to each other almost ever. The only other “How To” I was able to find was from Chris V’s, LinkedIn Blog Post. This was a great resource, and thank you Chris if you read this, and goes without saying — always credit those before you for the hard work they’ve done!
What sparked this idea was the amount of Twitter activity I was getting from a tweet I posted

I was absolutely taken back by how much traction this got from the community. I had several folks respond they wished to have something to help out with this in their own labs…so….
Let us get to it!

A Brief Introduction to KAPE
KAPE was developed by Eric Zimmerman, and is currently provided by Kroll to those in the community. There are some licensing things to consider before we get into the use of KAPE and the next tool. I would not be doing anyone a service by trying to describe any of that, but please ensure you read all documentation on the link provided to get access to the KAPE program.
In a nutshell, KAPE is a triage tool which provides the user the ability to leverage several different TARGETS and MODULES in order to conduct analysis very quickly. This tool has been widely considered to be one of the best tools in the Incident Responders toolbox, as it allows any analyst the ability to pull back data in a forensically sound way, in order for the Modules (or whichever tools an analyst wishes to use) to be executed and process the results in a user-friendly way (typically CSV, XML, JSON). This allows those analyst the ability to run things like GREP, PowerGREP, bstrings, etc., over these results in order to very quickly see results from Indicators of Compromise (IOCs) or conduct “eyes on” review of the data.
Much of Eric’s tools are at the forefront of the utilization of KAPE Modules. However, if anyone knows of unique tools that would be useful for processing artifacts, anyone can create these Targets and Modules respectively. My wonderful colleague, Andrew Rathbun, has done a lot of heavy lifting with KAPE and AboutDFIR is proud to host his hard work for anyone wishing to get a very detailed look at how to contribute to the KAPE project. Please see this link for more information on that!

A Brief Introduction to SOF-ELK
SOF-ELK is something that many may or may not have heard of. To try and describe everything it does would be a discredit to Phil Hagen, a great mentor of mine, and to get a good idea WHAT SOF-ELK is I would solicit any reader to watch the SANS video where Phil talks about it. Phil also spoke with fellow legend Dave Cowen on his Forensic Lunch quite a few years ago if you want something a bit more laid back.
Essentially though, SOF-ELK was designed around network forensics moreso than endpoint analysis. When it was created by Phil, there was not many visualization ways to help depict the sheer amount of data that an analyst can receive from an array of network forensic tools and other hardware/software solutions. I’m talking the GB’s upon GB’s of data collected in netflow on a 60k endpoint network. Or the ZEEK outputs that can be difficult to read unless you have been doing it for a long time. Additionally, tools such as MaxMind were supported (license sold separately) to help with geolocation of IPs to help find the evil as quickly as possible.
However, SOF-ELK is also an open-source tool that can be used by anyone! Phil supports it still to this day and there are many different configuration and ingestion routines that have been created as time has moved along, along with Phil’s “other child” SANS FOR572 which is the Network Forensics course that Phil is the lead instructor and author of.
So how did these two get married if one is for IR Endpoint analysis and the other is meant for Network Forensics?
I’ve truthfully never asked Phil, or any other instructor for that matter, why they were. My assumption is because KAPE was used in another SANS class where the data from the network side of the house was from the same scenario for that course. Having the capability to look at both sets of data TOGETHER (something that was extremely difficult to do with other tools) was a game changer! But like I said, I’ve never asked the real reason.
So enough of the Intro stuff — how do we do this??
This scenario is to help demonstrate how to actually ingest this information. For information relating to the SOF-ELK ingestion, please see the SOF-ELK Github repo for configuration files. For KAPE, please see all official documentation provided by Kroll. I do have plans to get more in-depth on how to make Dashboards and other great things in the ELK stack itself….but this is not that blog post. If there is support for that, please let me know on Twitter or through this site so I can make sure it is a worthwhile venture!
UPDATING
First, you need to update KAPE. One thing you’ll notice, even if you updated before the 20th of August, is that there are FOUR NEW MODULES within KAPE.
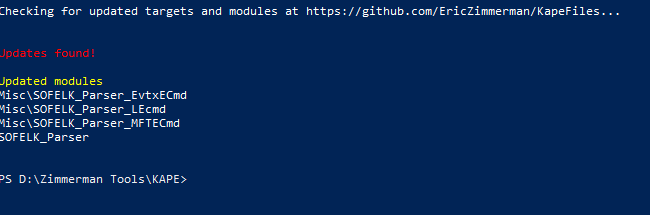
Andrew and I created these Modules over the weekend after some discussion about making it as “user friendly” as possible. That meant, we needed to tweak some things from the EZParser created by Phill Moore, and even the other Modules that were created by Eric when KAPE was first conceptualized.
What did we change?
Again, always remember that Targets and Modules are open-source. While Andrew and Eric do a fantastic job of weeding out things that don’t work — it is up to you to ultimately know what your tool is doing. You can easily go and review these Modules on your own if you would like.
However, the biggest changes were we didn’t want it to parse EVERYTHING that we see with EZParser, or some of the other Compound Modules. As of this writing, there are only 3 Modules that are supported within SOF-ELK:
Event Logs
LNK Files
MFT
The other change we made was to make JSON the default format for the eventual output files. This is because the only files that SOF-ELK supports for these ingestion types is JSON. So your CSV and XML are not going to work for it. Additionally, while this is a selection button in either GKAPE (GUI) and KAPE (Command Line), we know how often times we are working pretty quickly to get things done and a simple forgetfulness on this could mean several hours wasted processing KAPE packages. I would fully expect to see a KAPE Target created to just pull these files in the coming days as well.
Running KAPE 
When we run GKAPE, for this use case, there are a couple things we need to fill in. You’ll need to point where you want the files included. If you search for SOFELK, you’ll get the four Modules. The one you want to run is the SOFELK_Parser, which is located in the Modules category. This will run the other three parsers. 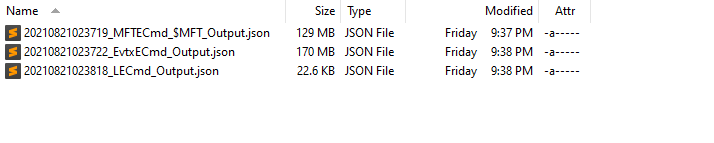
Once done, you’ll be greeted with these JSON files in the respective Module Destination location. Success!! We are now onto the next piece:
Turning on SOF-ELK Instance and Logging in

For this purpose, I’m using a VM — but I’m sure many will know how to get it containerized or something else fun (like Cloud-Based…) that I haven’t dove into. The information for the username and password are located on the SOF-ELK repo. Annotate that somewhere, and power it on. From there, you will be greeted with the IP Address:PORT (5601) for the Kibana web instance and the IP Address for SSH (same IP address in my case). This allows you to get the data into the instance. After all, what is the point of this if you can’t get your data in?!?!? There are many ways to do this, but I found SCP to be the most useful, and didn’t require other software and is pretty robust across the OS Platforms.
![]()
This may be difficult to see what is going on, but largely you need to run this command:
scp FILE1 FILE2 FILE3 IPADDRESS@elk_user:/logstash/kape
I’m sure there are better ways to move files, like just compressing and unzipping on the instance….but for this case I wanted to keep it as user-friendly as possible. By doing it this way, it “technically” eliminates needing to log into the SOF-ELK instance and unzipping.
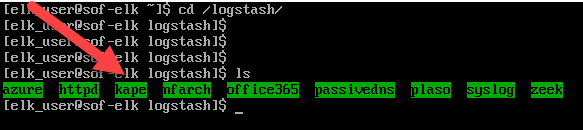
When done, you can go to the already created directory on SOF-ELK to verify, if needed. It is in the ~/logstash directory.
Logging into ELASTIC
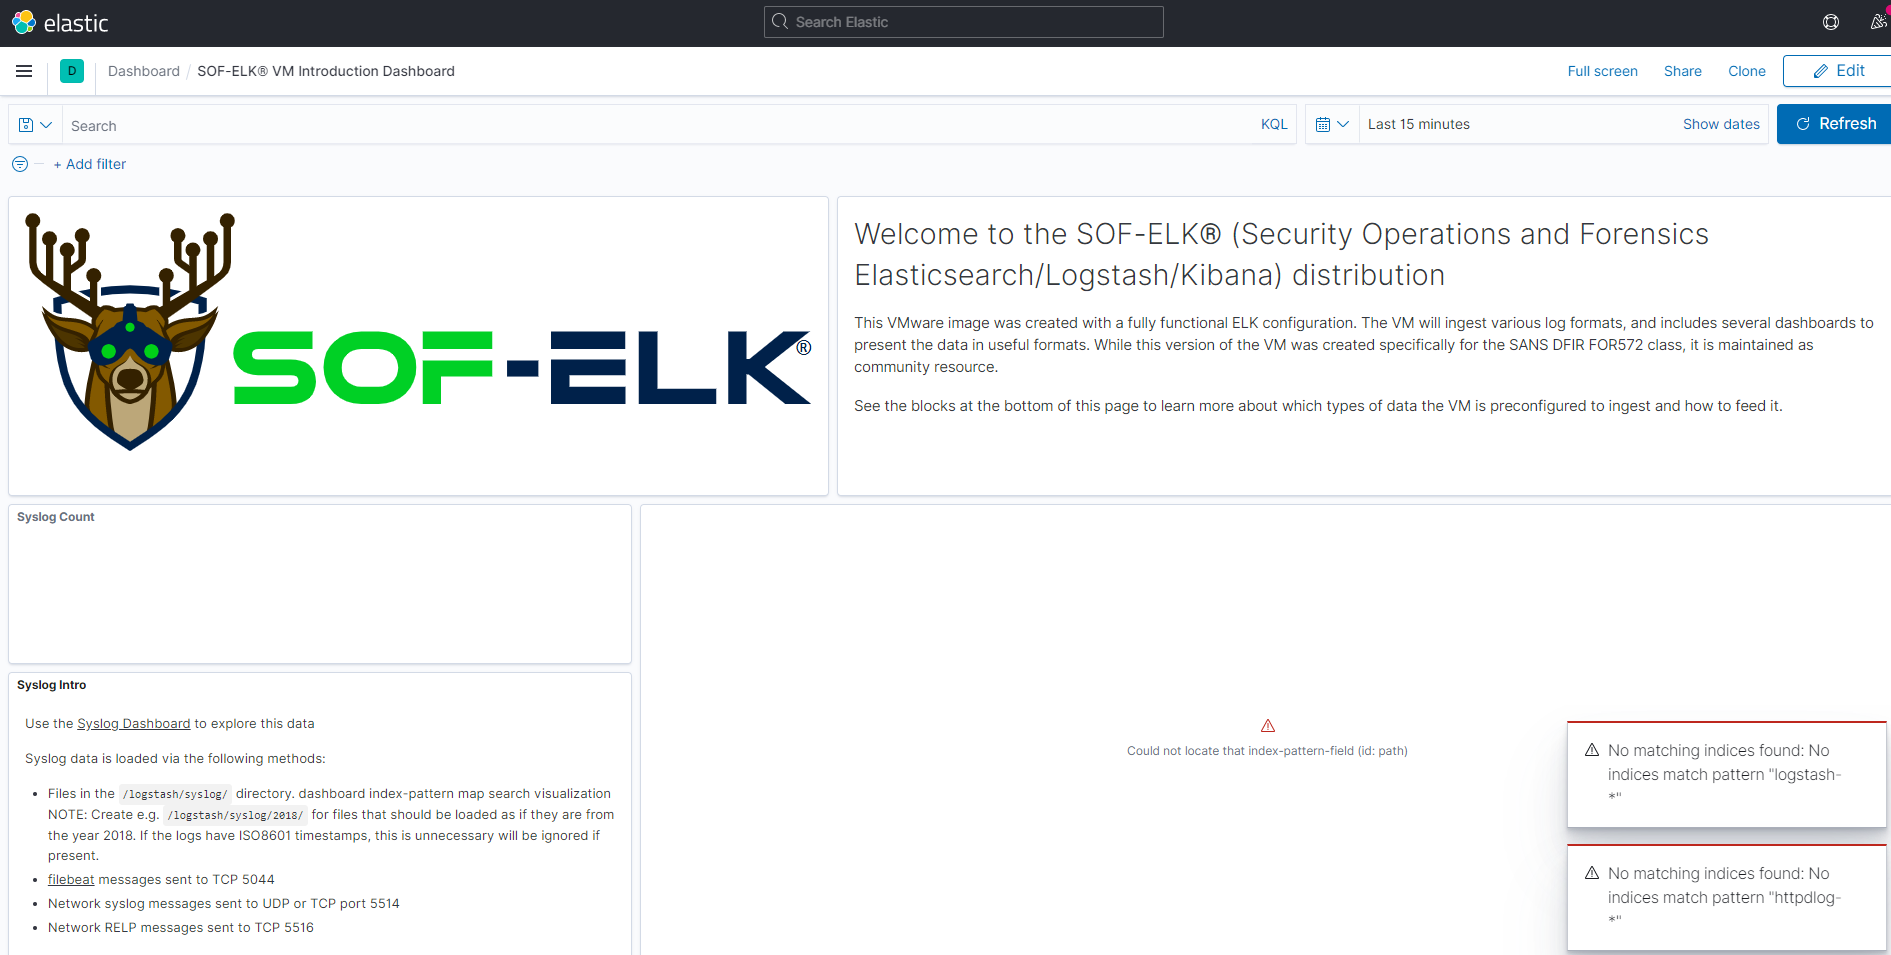 Once you have ingested the files, give it a little bit of time to catch up — then using your favorite web browser, traverse to the IP address and Port provided to you from the SOF-ELK instance. This will be the Dashboard locations for each of the dashboards for each artifact type:

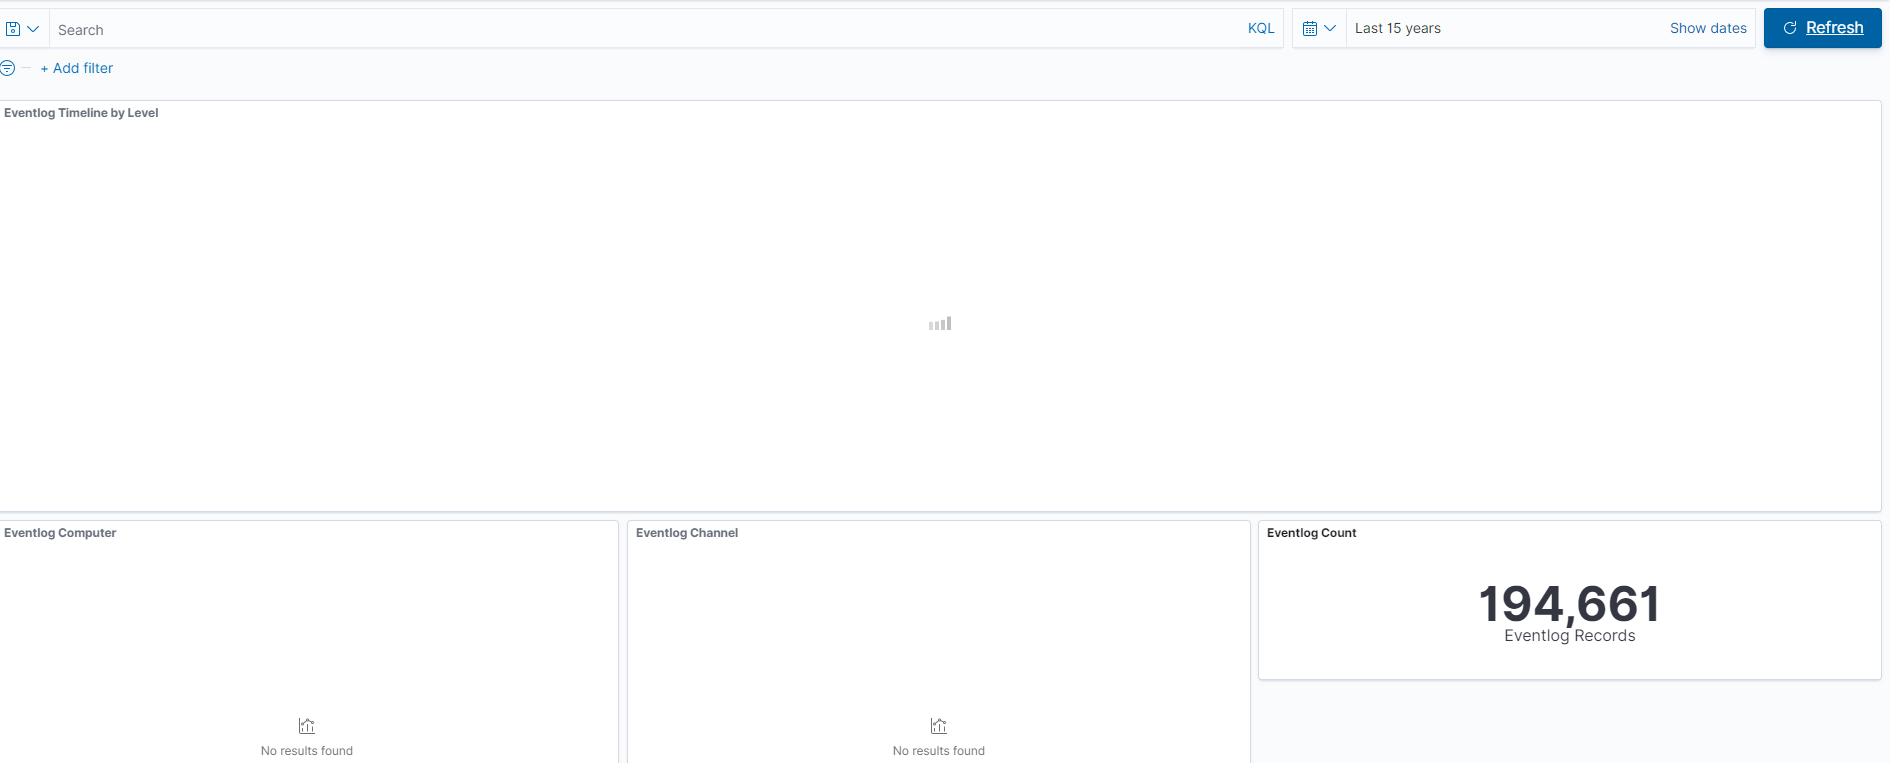
Once you’re in the Dashboard you want to look at (in this case we are in the Event Logs one), you’ll need to make a quick change. I’ve highlighted in red the TIME area you need to change. You’ll notice that it probably says something like “15 minutes ago” — most likely this is not going to show you any results. Select your date range, or move it to whatever you prefer and you’ll see something like this:
You’ll notice almost immediately that we start to see Event Logs populating when you get to your desired time. This is good!! It means SOF-ELK sees your data and you’re about to see some pretty stuff….
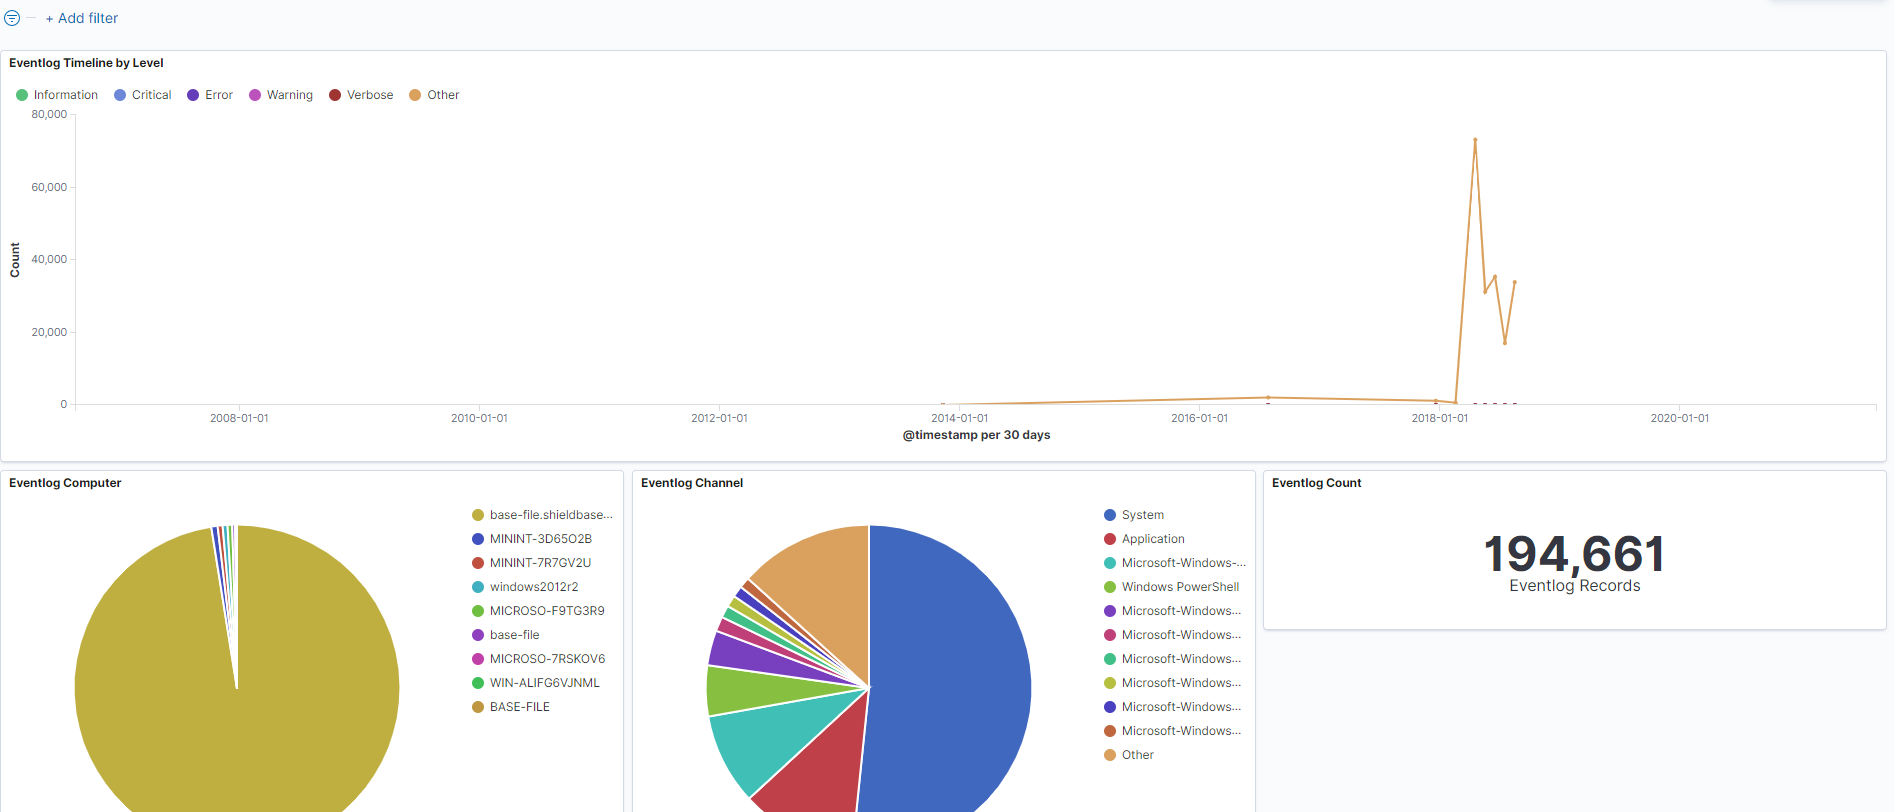
Annnnnnd just like that, we have graphics and other visual depictions of our data. From here, we can start to pick apart whatever we need based on what we are observing!
Congrats! You have successfully ingested KAPE outputs into SOF-ELK and can now start ripping through them in a more visual way to get to your unsolved questions!!
What Else is to Come??
One of the absolute biggest reasons I fell in love with this aspect is what it can be done at a major scale. For example, throwing almost 50 systems of Event Logs, MFT, and LNK files didn’t even break a sweat for SOF-ELK! This means if you are in an agency that doesn’t have a premium SIEM or Indexing tool to help rip through things like Event Logs, or others — this is a fantastic way to build out a way of seeing when accounts laterally moved OR if accounts were logging in at weird hours. Moreover, what we found with MFT’s is the ability to throw 50 system’s MFT’s and build out a date range to look for key file extensions!! So if you were looking for things like data staging….this is a fantastic way to rip through GIGABYTES of MFT data quickly to see if you have anything that requires a deeper look!
Next Plans:
- Write the Target to pull the relevant files needing for SOF-ELK as its own independent Target. This should help those who need to move quickly on data and wish to use this method as opposed to waiting for KapeTriage, or other major collection options.
- Get the PECmd Module created, as it was resolved in Github Issue #163
- More in-depth blog on how to build Dashboards for visualization and assist with searching
- Wait and hope some folks with configuration file guru skills can build out (or help) more of the great toolsets out there that KAPE can help automate!

